Posts tagged cartography :

Drawing a GPX Track on a Map in Python

in Programming by evan power
Tags: , , ,

Programming in python is fun because you can do complex things relatively easy. Incredibly powerful libraries are just a 'pip install' away. Today I'll show you a quick example using a few such libraries to create a simple map with a GPS track drawn on it.

We will be using the GPXPY package to parse our gps track, and the Cartopy and Matplotlib packages do draw the underlying map and draw the GPS track on it.

We will be using Stamen Terrain map tiles.

First open a terminal emulator and type "pip install gpxpy matplotlib cartopy" You may need to add 'sudo' to the beginning of the 'pip install' command.

Run the code below. Set the trackFile variable so that it contains a path that points to the gpx file that you want to show on the map.

import gpxpy
import array
import matplotlib.pyplot as pyplot
import cartopy.crs as crs
from cartopy.io.img_tiles import StamenTerrain

# Open and parse your GPX file.
trackFile = './pemberton.gpx'
track = gpxpy.parse(open(trackFile))
# Make an iterator over the points in the GPS track.
trackPoints = track.walk()
# Make empty arrays to put the latitudes an longitudes in.
lats = array.array('f')
lons = array.array('f')
# Iterate over all points an populate the latitude and longitude arrays.
for p in trackPoints:
    lats.append(float(p[0].latitude))
    lons.append(float(p[0].longitude))
# Get the minimum and maximum latitudes and longitudes from the GPS track.
bounds = track.get_bounds()
# Use the Stamen Terrain tile server
tiler = StamenTerrain()
fig = pyplot.figure(figsize=(5,5))
axes = pyplot.axes(projection=tiler.crs)
axes.set_extent([bounds.min_longitude, bounds.max_longitude,
                bounds.min_latitude, bounds.max_latitude])
zoom = 14
axes.add_image(tiler, zoom)

pyplot.plot(lons, lats, 'm-', transform=crs.Geodetic(), linewidth=2)
pyplot.savefig('map.png')

The output looks like this:

map

Easy peasy.

Thanks to th developers of Python, GPXPY, Cartopy, Matplotlib for their work, and thanks to the folks at Stamen for making their map tiles pretty an easy to use.

Mountain Bike Map T-Shirt

in Craftwerks by evan power
Tags: , , , ,

shirt graphic
I decided to make this shirt after playing with an intriguing piece of software called OSMnx. OSMnx is a Python module that retrieves road and trail networks from Open Street Map, and can make high quality images of those networks.

I'm no graphic designer but I love t-shirts and I sometimes find myself thinking "The Ramones are great, and I like wearing their logo on my shirt, but what else am I enthusiastic about that can be easily put on a t-shirt?". I absolutely love the trails in Squamish, particularly Entrails and the trails that branch off of it. Many of Squamish's mountain bike trails are mapped in Open Street Map so with OSMnx it was easy and fun to put bike trails in a form that can be screen-printed onto a t-shirt.

To generate an image of the Squamish road and trial network I entered the following lines into a Python interactive interpreter:

import osmnx as ox  
g = ox.graph_from_place('Squamish, Canada', network_type='bike', simplify=False)  
gproj = ox.project_graph(g)  
gsimp = ox.simplify_graph(gproj)  
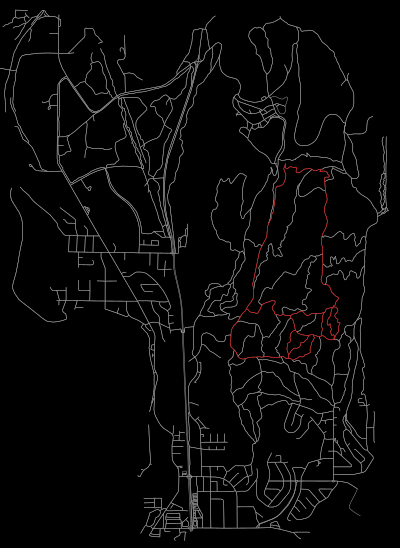
ox.plot_graph(gsimp, fig_height=30, node_size=0, edge_linewidth=0.5, save=True, file_format='svg', filename='squamishbike')

In my case this created a file called 'squamishbike.svg' in the 'images' folder in my home folder. The location of the output will vary depending on your operating system.

I used Inkscape (an excellent free and open source vector graphics editor) to crop the image and highlight a few permutations of my favorite Entrails loop; and I sent the resulting image off to a t-shirt printing company.

Thanks to all of the trail builders and maintainers, and code builders and maintainers, and Open Street Map contributors who made this project possible!